Blog
Our Perspectives
We keep it simple: valuable ideas, data visualization techniques, and data-driven storytelling.
We keep it simple: valuable ideas, data visualization techniques, and data-driven storytelling.
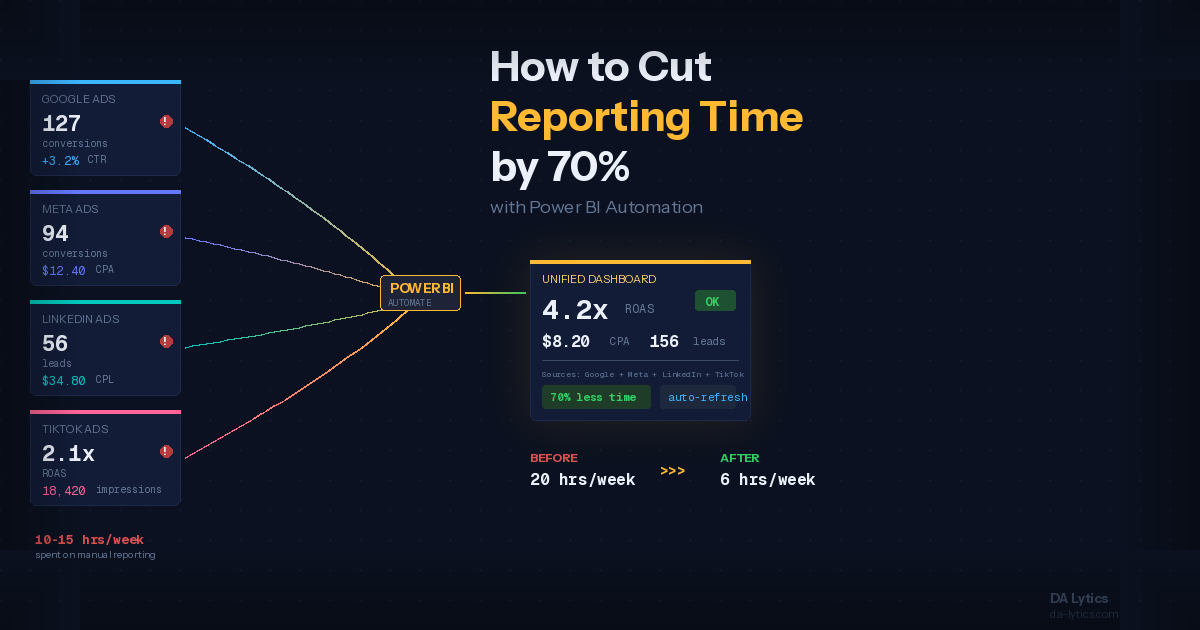
For Data Visualization we use Microsoft Power BI.
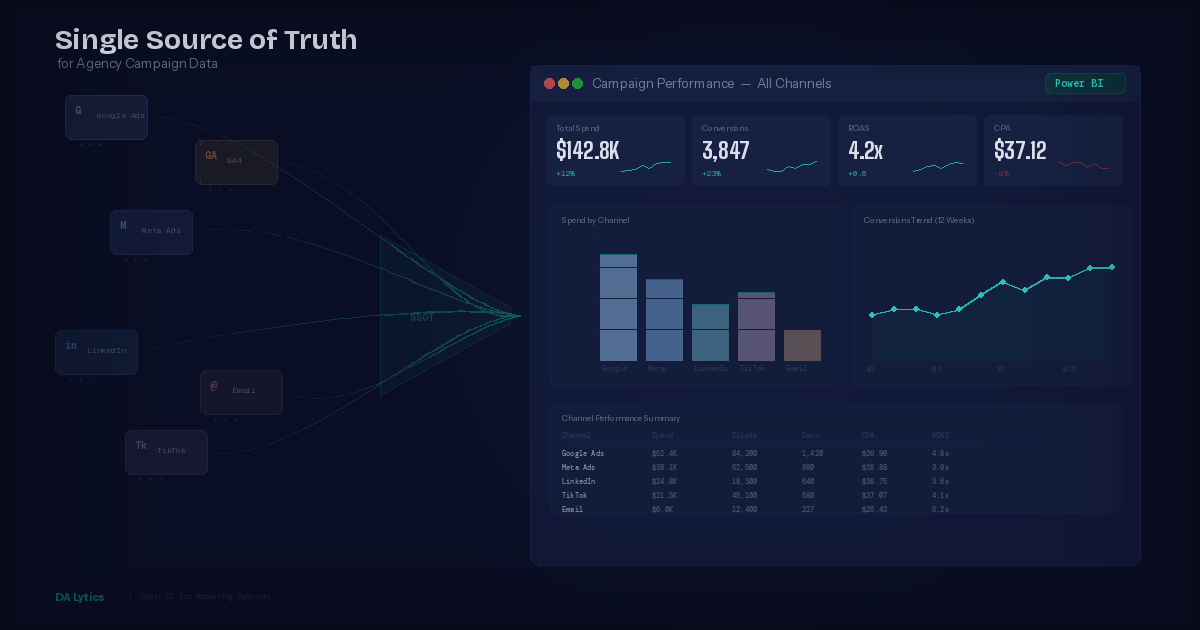
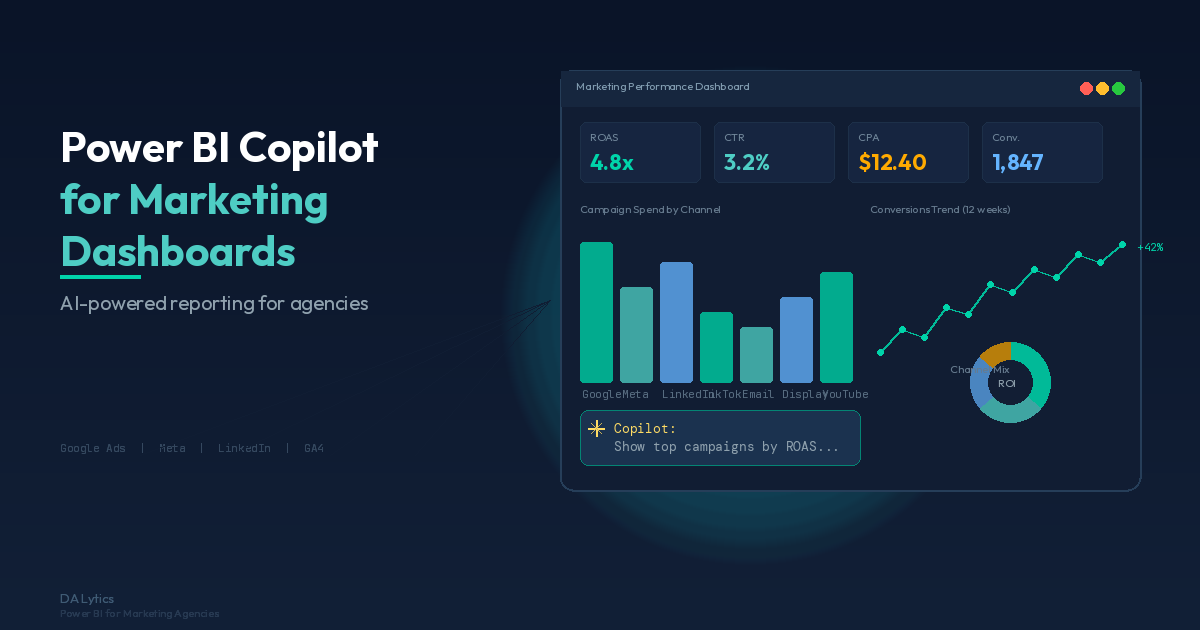
Power BI stands for Power Business Intelligence and refers to a collection of software services, tools, and connectors that help you transform data from multiple sources into actionable insights.
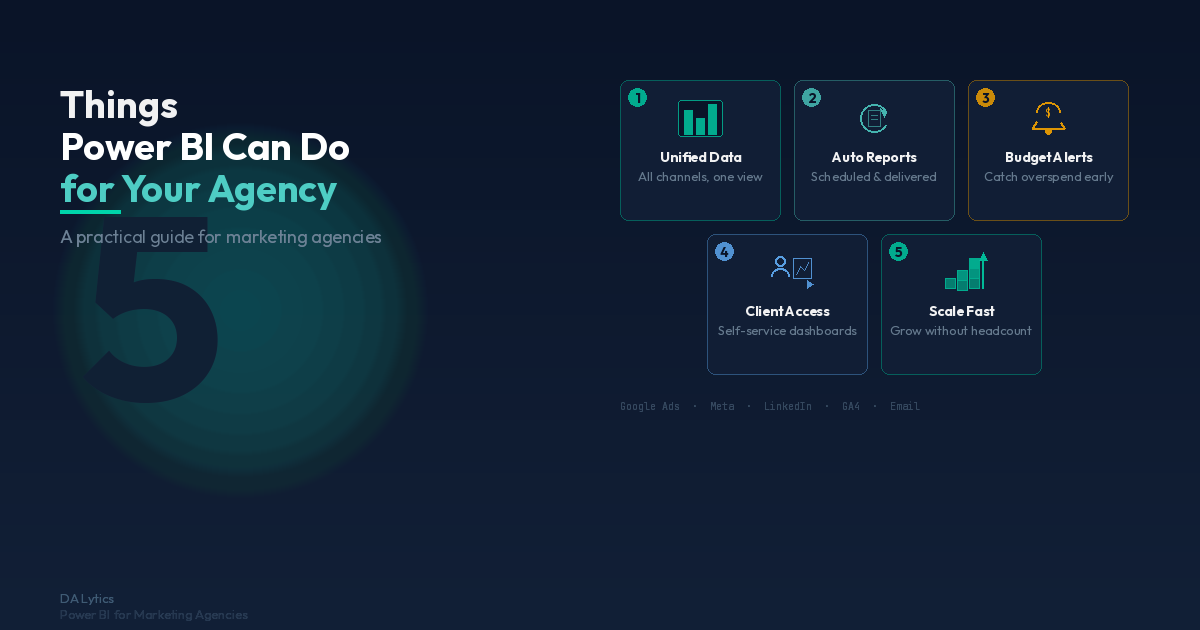
Data analytics turns your numbers into insights, helping you save time, spot opportunities, improve efficiency, and make smarter business decisions.
We handle the full data engineering process, from gathering and cleaning to processing your data, using established tools and technologies.
We provide specialists with proven experience, relevant certifications, and skill sets tailored to each project. This way, you can trust that the experts working on your data are highly qualified and the right fit for your needs.
DA Lytics provides comprehensive data analysis, enabling informed and strategic decision-making.
Get In Touch