How to Use Power BI Copilot for Marketing Dashboards
DA Lytics Team
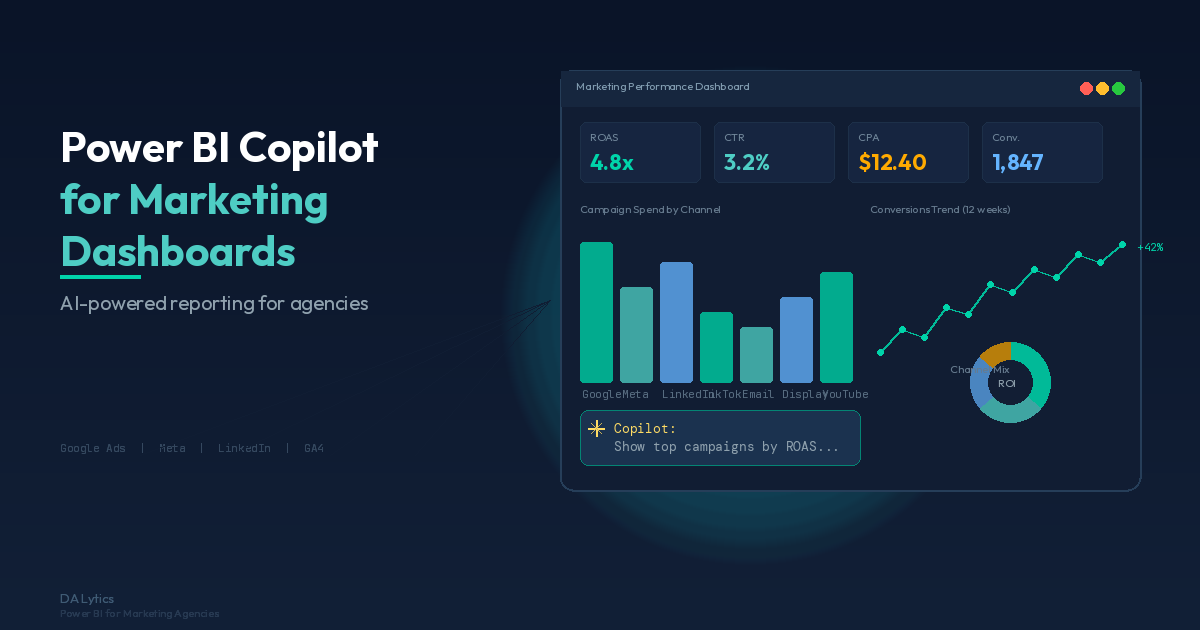
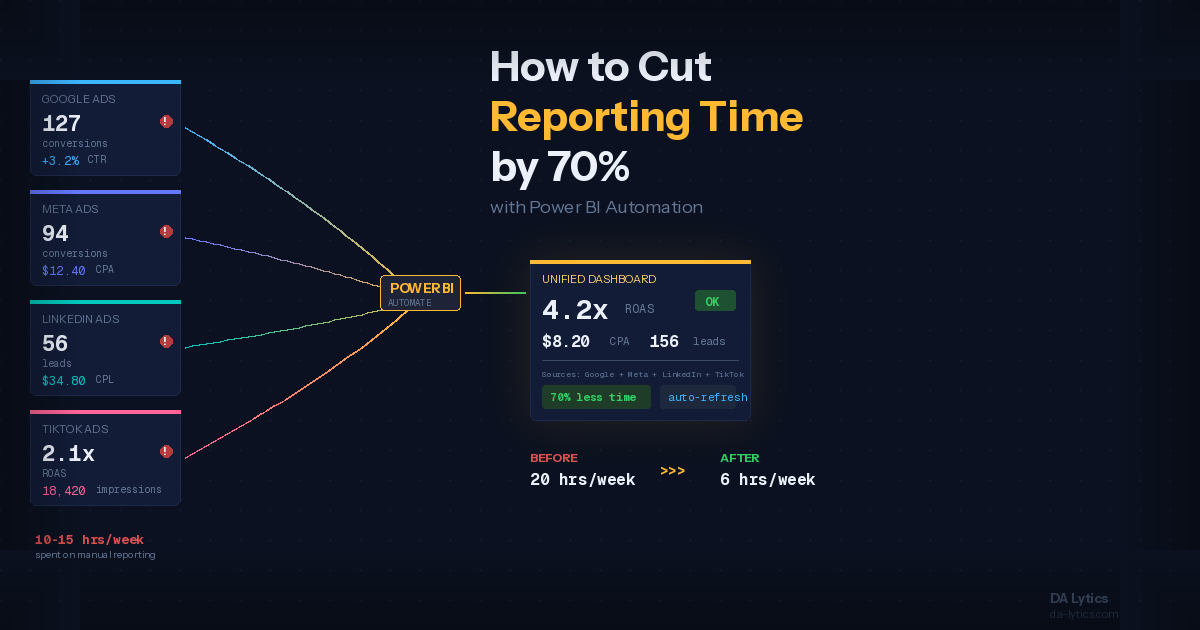
Marketing agencies spend hours every week building dashboards from scratch -- connecting data sources, formatting visuals, and tweaking layouts until they look right. What if an AI assistant could do most of that work for you? With Power BI Copilot, that scenario is now a reality. Microsoft's AI-powered assistant can generate visuals, write DAX formulas, and summarize data from natural language prompts, and the latest 2026 updates have made it significantly more capable for marketing teams. In this guide, we walk through exactly how marketing agencies can use Power BI Copilot to build client dashboards faster, with practical examples from real agency workflows.
What Is Power BI Copilot and Why Should Agencies Care?
Power BI Copilot is Microsoft's generative AI feature built directly into Power BI Desktop and the Power BI Service. It uses large language models to understand plain-language requests and translate them into report visuals, DAX calculations, and data summaries. For marketing agencies managing multiple client accounts, this changes the game. Instead of manually building each visual from a blank canvas, you can describe what you need and Copilot generates it.
The reason this matters specifically for agencies is scale. A typical agency might manage reporting for ten, twenty, or even fifty clients. Each client has different KPIs, different platform mixes, and different reporting preferences. Copilot lets analysts produce a working first draft of a dashboard in minutes rather than hours. Your team can then spend their time refining insights and telling the data story rather than fighting with formatting.
As of early 2026, Microsoft has expanded Copilot's input limit from 500 characters to 10,000 characters, which means you can now give it highly detailed prompts. You can describe an entire dashboard layout, specify which metrics go where, and even reference specific tables in your semantic model. This is a major step forward from the initial release where prompts had to be short and generic.
Setting Up Power BI Copilot for Marketing Data
Before you can use Copilot effectively, your data model needs to be well-structured. This is where many agencies stumble. Copilot works best when your tables are clearly named, your measures are documented, and your relationships are clean. If your data model is a mess of generic column names like Value1 or Metric_A, Copilot will struggle to give you useful results.
For marketing agencies, the typical data pipeline starts with an ETL tool like Funnel.io that collects data from platforms such as Google Ads, Meta Ads, LinkedIn, TikTok, and Google Analytics. Funnel normalizes this data and sends it to a destination -- either directly to Power BI via the Funnel connector in Power Query, or to a data warehouse like BigQuery. From there, Power BI connects to the warehouse and builds the semantic model.
Here is what a solid setup looks like for Copilot to work well with marketing data. Your fact tables should be clearly named, such as Campaign Performance or Ad Spend Daily. Dimension tables should follow the same pattern: Channels, Campaigns, Clients. Measures should have descriptive names like Total Impressions, Cost Per Acquisition, or Return on Ad Spend. When Copilot reads your model, it uses these names to understand what the data represents. Clear naming is not just good practice -- it is the foundation that makes Copilot actually useful.
Five Practical Ways to Use Copilot for Agency Dashboards
Once your data model is ready, Copilot can accelerate dashboard creation in several concrete ways. Here are five workflows we have seen work well in agency environments.
1. Generating a report page from a prompt. With the February 2026 update, you can now attach a semantic model to Copilot chat and ask it to build an entire report page. For example, you could type: Create a page showing monthly ad spend by channel, cost per click trend over the last 12 months, and a table of top 10 campaigns by conversions. Copilot will generate the visuals, place them on the canvas, and connect them to the correct fields. It is not perfect every time, but it gives you a solid starting point that would have taken 30 to 45 minutes to build manually.
2. Writing DAX measures with natural language. DAX can be intimidating, especially for analysts who come from a marketing background rather than a data engineering one. Copilot can write measures for you. Ask it to create a measure that calculates return on ad spend as revenue divided by ad spend, formatted as a percentage. It will generate the DAX, explain what it does, and you can insert it directly into your model. This is particularly useful for complex calculations like weighted attribution models or rolling averages.
3. Summarizing dashboard insights. One of Copilot's strongest features for agencies is its ability to generate narrative summaries of what the data shows. When you are preparing a client report, you can ask Copilot to summarize key trends, identify anomalies, or highlight which campaigns performed best. This saves your team from writing those summary paragraphs manually, and it catches patterns that might not be immediately obvious from looking at the visuals alone.
4. Answering ad-hoc client questions. Clients often ask questions that do not have a dedicated dashboard visual. What was our cost per lead in Germany last quarter? Or which creative had the highest click-through rate in February? Instead of building a new visual or running a query, you can ask Copilot directly in the report. It searches the semantic model and returns the answer in seconds. This is especially powerful during live client calls.
5. Creating data-driven talking points for meetings. Before a client meeting, you can use Copilot to generate a quick summary of performance highlights, areas of concern, and recommended next steps. Paste these into your meeting agenda or presentation, and your team walks into the room fully prepared without spending an hour reviewing numbers manually.
What About the New Input Slicer for Marketing Filters?
One feature from the February 2026 update that deserves special attention for agencies is the renamed Input Slicer, previously called the Text Slicer. This interactive visual lets users filter data using free-form text input with options for exact match, contains, or starts with. For marketing dashboards, this is a practical upgrade. Imagine a client dashboard with hundreds of campaign names -- rather than scrolling through a long dropdown, users can type Brand_UK and instantly filter to see only UK brand campaigns. Combined with Copilot's ability to generate these filter configurations from a prompt, you can set up flexible, user-friendly dashboards much faster.
Another useful addition is the Modern Visual Tooltips feature, which is now generally available. Tooltips now include an Actions footer that lets users drill down, drill up, or drill through data points directly from the tooltip. For agency dashboards where stakeholders need to quickly move from a high-level campaign overview to granular ad group or creative performance, this reduces the number of clicks and makes the dashboard feel more intuitive to non-technical users.
Limitations to Be Aware Of
Copilot is powerful, but it is not a replacement for a skilled BI developer. There are several limitations agencies should understand before relying on it too heavily.
First, Copilot requires a Power BI Premium or Fabric capacity. It is not available on Pro licenses alone, which means smaller agencies may need to budget for the upgrade. Microsoft introduced Fabric Copilot capacity in early 2026 to help organizations consolidate Copilot usage across Desktop, Pro, and Premium workspaces, but it still requires a capacity commitment.
Second, Copilot visual recommendations are generic. It will choose standard bar charts, line charts, and tables based on your data. It will not produce the kind of polished, branded dashboards that agencies typically deliver to clients. You will still need to apply custom themes, adjust colors to match client branding, and refine layouts. Think of Copilot as your first draft, not your final product.
Third, Copilot works best with clean, well-modeled data. If your data has inconsistencies, missing relationships, or ambiguous naming, Copilot output will reflect that. Garbage in, garbage out still applies, even with AI.
Finally, accuracy verification is critical. Copilot-generated DAX measures and summaries should always be reviewed by someone who understands the data. We have seen cases where Copilot generates a technically correct measure that does not account for specific business logic, like excluding internal test campaigns or handling currency conversions. Always validate before sharing with clients.
How to Get Started This Week
If your agency is already using Power BI, adding Copilot to your workflow is straightforward. Start by ensuring your semantic model has clear, descriptive names for all tables, columns, and measures. Then enable Copilot in your Power BI workspace settings if you have the required capacity.
A good first project is to pick one existing client dashboard and try rebuilding the first page using Copilot prompts. Compare the time it takes versus your normal workflow. In our experience, teams typically see a 40 to 60 percent reduction in initial build time for standard report pages. The time savings compound when you scale across multiple clients.
For agencies using Funnel.io as their data pipeline, the combination is especially effective. Funnel handles the complex work of collecting and normalizing data from hundreds of marketing platforms, while Power BI with Copilot handles the visualization and insight generation. This two-tool stack can reduce end-to-end reporting time from hours to minutes for recurring reports.
If you are exploring whether Power BI and Copilot are the right fit for your agency reporting needs, we can help. At DA Lytics, we specialize in implementing Power BI reporting solutions for marketing agencies, from data pipeline setup with tools like Funnel.io and BigQuery to building interactive dashboards that your team and clients will actually use. Get in touch to discuss your reporting setup, or explore our other guides on the DA Lytics blog.