How Marketing Agencies Automate Multi-Platform Campaign Reporting in Power BI
Power BI | Marketing Analytics | Campaign Reporting | Ad Platform Integration

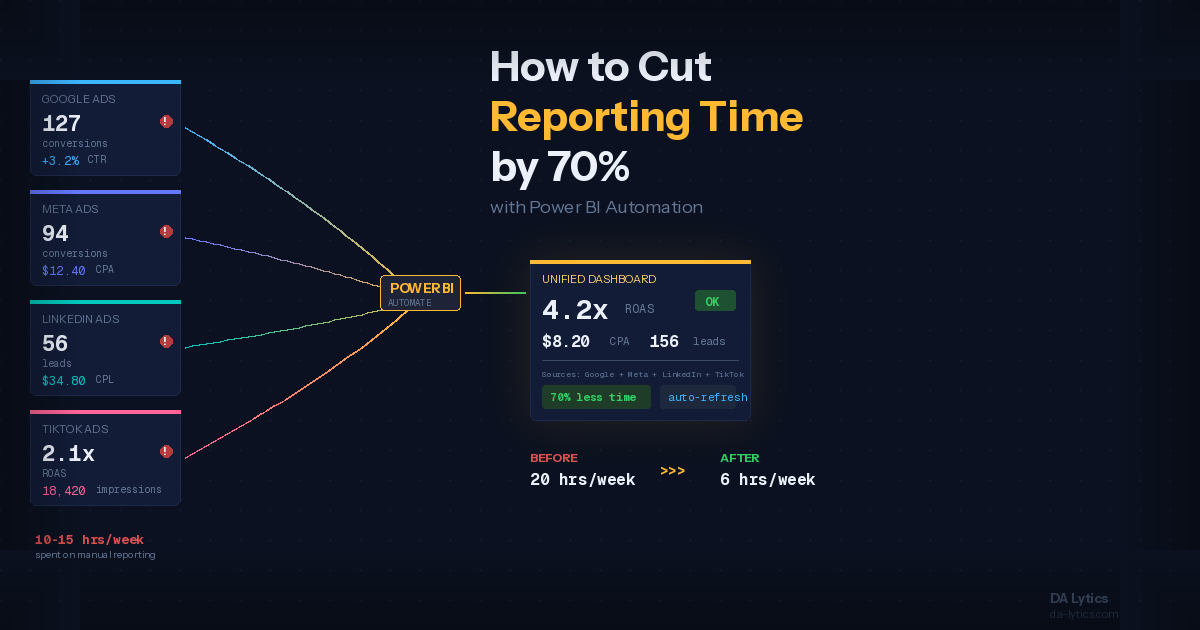
The Monday Morning Report Problem
Every marketing agency knows the drill. The week ends, the client wants performance numbers, and someone spends hours pulling data from TikTok Ads Manager, Meta Business Suite, Google Ads, LinkedIn Campaign Manager — each with its own export format, its own date logic, its own way of labeling the same metric differently.
The result is a spreadsheet that took half a day to build, is already out of date, and needs to be rebuilt from scratch next week.
This is the problem Power BI solves for marketing agencies — but the first question is always: how do you actually get the data from all those platforms into one place, automatically?
The Options for Connecting Ad Platforms to Power BI
There is no single universal method. The right approach depends on your agency's size, technical resources, and reporting requirements. Here's an honest overview of what's available.
No-Code Connector Tools
Tools like Funnel.io, Supermetrics, Windsor.ai, and Coupler.io sit between your ad platforms and Power BI. They handle all the API connections to TikTok Ads, Meta, Google Ads, LinkedIn, Twitter, and dozens of other platforms — normalizing the data into a consistent format and making it available to Power BI on an automated schedule.
This is the approach we use at DA Lytics. It removes the complexity of managing individual API connections for each platform, handles schema changes when platforms update their APIs, and keeps the focus on what actually matters — building reports that help agencies and their clients make faster decisions.
Direct API Connections
Every major ad platform — TikTok, Meta, Google, LinkedIn — has a marketing API that Power BI can connect to directly. This gives you full control over exactly what data you pull and how it's structured, but it requires technical setup, ongoing maintenance, and someone to handle it when API tokens expire or platform changes break the connection.
This approach makes more sense for larger agencies with dedicated data engineering resources, or for very specific reporting requirements that connector tools can't handle.
Manual CSV Exports + Power Query
For agencies just getting started with Power BI reporting, or for platforms with limited API access, structured CSV exports processed through Power Query is still a viable option. The key is building the transformation logic properly once — so that new weekly exports get picked up and processed automatically without rebuilding the report each time.
It requires more manual touchpoints than the other options, but the report-building effort is a one-time investment.
What a Multi-Platform Agency Campaign Report Actually Tracks
Getting the data into Power BI is only half the problem. The other half is knowing what to build with it.
A well-structured agency campaign report covers four areas:
Performance overview — total spend, impressions, clicks, CTR, CPC, CPM, conversions, and CPA across all platforms in one view. The goal is to answer "how did we do this week?" without switching between platforms.
Budget pacing — how much of the campaign budget has been spent vs. how much should have been spent by now, and a projection of where spend will land by end of flight. This is the number clients ask about most and the one that prevents end-of-month surprises.
Channel and platform breakdown — how TikTok is performing vs. Meta vs. Google vs. LinkedIn. Not every platform works equally well for every client — the report should make this visible so budget can be reallocated toward what's working.
Creative performance — CTR and conversion rate by ad creative, so the creative team knows what to make more of and what to retire. On TikTok specifically, video completion metrics (how far into the video people watch) add an extra layer of creative insight that other platforms don't offer in the same way.
What Makes a Good Agency Report vs. a Cluttered One
The temptation when you have access to all this data is to include everything. Every metric, every breakdown, every dimension available from every platform.
The result is a report nobody uses because nobody knows where to look.
The reports that actually get used — and that clients value — are built around decisions, not metrics. For each section of the report, the question to ask is: what action does this enable? If a number on the report can't change what someone does, it probably doesn't need to be there.
For most agency clients, the decisions that matter are: where to move budget, what creative to scale, whether the campaign is on track, and where performance is underdelivering against target. Build the report around those four things and you've covered 90% of what clients actually need.
How We Build This for Agencies at DA Lytics
At DA Lytics, we design and build Power BI reporting systems for marketing agencies that need automated, client-ready dashboards across multiple ad platforms.
Depending on your agency's needs and existing setup, we implement both connector-based solutions like Funnel.io and direct API integrations — paired with a Power BI data model built specifically for agency reporting, covering pacing, creative performance, channel comparisons, and period-over-period analysis in a single report that refreshes automatically every week.
If your agency is still building campaign reports manually, we can help you replace that process with something that runs itself.
See It in Action
We built a live example of this kind of multi-platform campaign report in Power BI — aggregating data across paid social and search channels into a single weekly reporting view.