How to Fix Conflicting Marketing Data with Power BI
DA Lytics Team

The Hidden Cost of Conflicting Marketing Data
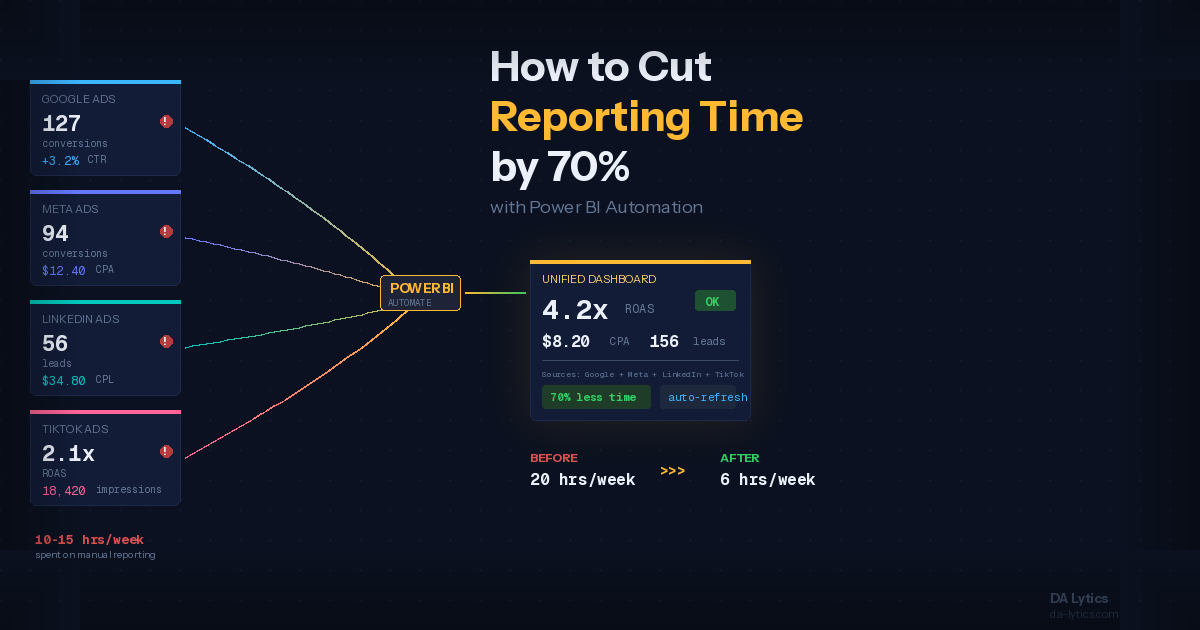
Your Meta Ads Manager says the campaign generated 127 conversions. Google Analytics reports 94. Your CRM logged 156 new leads. Same campaign, same time period, three completely different numbers. If this scenario sounds painfully familiar, you are not alone. Research from the 2026 Marketing Data Report shows that nearly eight in ten marketers say they still do not have a clear signal on what is truly working, despite record investment in analytics tools.
For marketing agencies managing multiple clients and dozens of platforms, conflicting data is not just an annoyance. It erodes client trust, wastes analyst time, and leads to budget decisions based on guesswork rather than evidence. In this guide, we walk through why marketing data conflicts happen, how Power BI can serve as the engine for resolving them, and the practical steps your agency can take to deliver reporting your clients actually trust.
Why Marketing Platforms Never Agree on the Numbers
Before you can fix conflicting data, you need to understand why it happens in the first place. The root cause is not that any single platform is lying. Each tool measures success using its own definitions, attribution windows, and tracking methods.
Google Analytics uses session-based tracking with a default last-click attribution model. Meta Ads Manager uses a view-through and click-through attribution window that can be set to 1, 7, or 28 days. TikTok, LinkedIn, and Google Ads each have their own attribution logic as well. When a user clicks a Facebook ad, visits your site three days later through organic search, and then converts, Facebook claims the conversion while Google Analytics credits organic search. Both are technically correct within their own systems, but the numbers will never match.
On top of attribution differences, there are practical data issues. Platforms use different date formats, time zones, and currency conversions. Cookie restrictions and privacy regulations have made browser-based tracking less reliable, which means platform-reported data and analytics-reported data diverge even further. The average marketing technology stack now includes over 120 potential touchpoints, and each one generates its own version of reality.
For agencies, this problem compounds with every client and every platform you add. Data analysts can spend 40 to 60 percent of their time just fetching, cleaning, and trying to reconcile numbers from different sources instead of generating insights that actually move the needle.
How Power BI Solves the Data Conflict Problem
Power BI is not just a visualization tool. When configured correctly, it becomes the central reconciliation layer where all your marketing data meets, gets standardized, and tells one coherent story. Here is how it works in practice for marketing agencies.
Centralized data ingestion. Power BI connects to virtually any data source your agency uses. Through native connectors, tools like Funnel.io, or custom API connections built in Power Query, you pull data from Google Ads, Meta, LinkedIn, TikTok, Google Analytics, your CRM, and any other platform into a single data model. Instead of comparing screenshots from five different dashboards, all numbers live in one place.
Standardized metrics with Power Query. Power Query, the data transformation engine inside Power BI, lets you normalize metrics before they ever reach a dashboard. You can align date formats, convert currencies, rename columns to use consistent terminology, and define your own conversion logic. When every platform's data passes through the same transformation pipeline, you eliminate the ambiguity that causes conflicting reports.
Custom attribution logic. Rather than accepting each platform's self-reported conversions at face value, Power BI lets you build your own attribution model using DAX. You can create measures that deduplicate conversions, apply your preferred attribution methodology such as last-click, linear, or time-decay, and compare platform-reported numbers side by side with your reconciled figures. This gives your clients a transparent view of how the numbers were calculated and why they differ from what each platform reports individually.
Automated data refresh. Once your data model and transformations are set up, Power BI Service can refresh your datasets on a schedule. Your clients see updated, reconciled numbers every morning without anyone on your team manually pulling reports. This is a game changer for agencies that manage reporting across ten or more clients.
A Practical Framework for Reconciling Marketing Data
Fixing conflicting data is not something you do once and forget about. It requires a structured approach that your agency can repeat for every client. Here is a five-step framework we use at DA Lytics when building reconciled reporting solutions for marketing agencies.
Step 1: Audit your data sources. Start by listing every platform that generates campaign data for the client. Document what each platform tracks, how it defines a conversion, and what attribution window it uses. This audit alone often reveals why numbers conflict and helps you explain the discrepancies to clients in plain language.
Step 2: Choose a source of truth for each metric. Not every metric needs to come from the same source. For ad spend, the advertising platform itself is usually the most accurate source. For website conversions, Google Analytics or your CRM might be more reliable. For revenue, the CRM or e-commerce platform is typically the definitive source. Decide which system is the authority for each key metric and document these decisions.
Step 3: Build a transformation layer in Power Query. Create Power Query transformations that clean and standardize data from each source. This includes aligning date and time formats, applying consistent campaign naming conventions using text transformations, converting currencies to a single reporting currency, and mapping platform-specific metric names to your standardized terminology. A well-built transformation layer means you can add new data sources without rebuilding your entire data model.
Step 4: Create reconciliation measures in DAX. Build DAX measures that compare platform-reported metrics with your reconciled figures. For example, you might create a measure that shows the variance between Meta-reported conversions and your CRM-verified conversions. These reconciliation measures help your team spot data quality issues early and give clients full transparency into how the numbers are calculated.
Step 5: Automate and monitor. Set up scheduled refreshes in Power BI Service and create alerts for data anomalies. If a data source stops updating or numbers spike unexpectedly, you want to know before your client does. Power BI allows you to configure data-driven alerts that notify your team when a metric crosses a threshold, so you can investigate and resolve issues proactively.
What This Looks Like for Your Clients
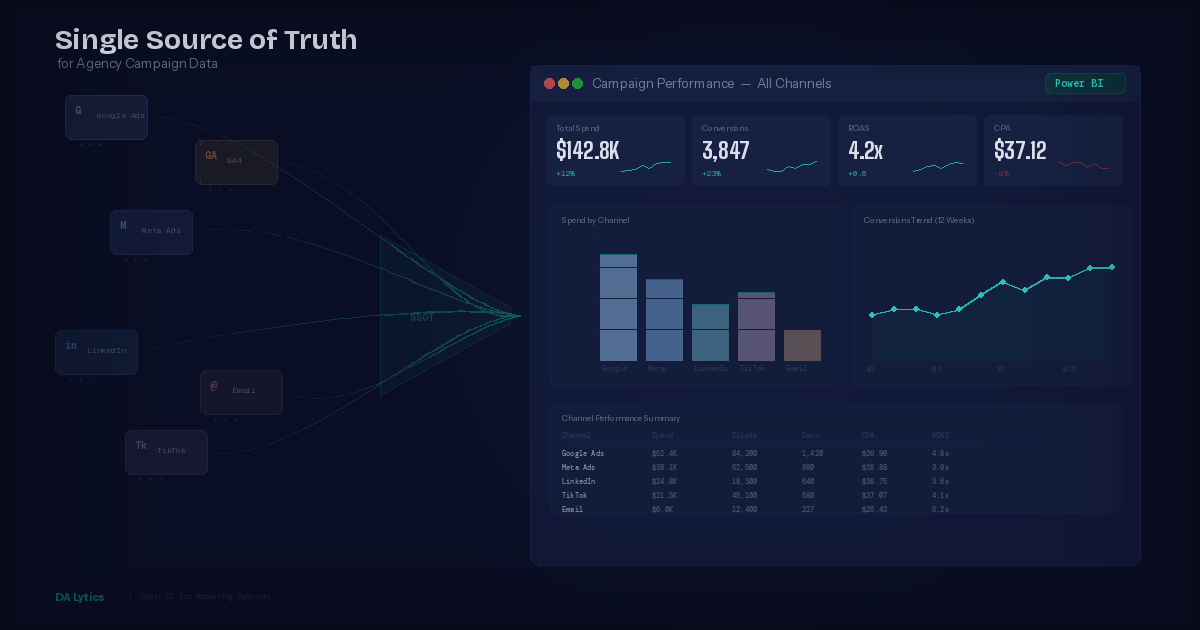
When you deliver a reconciled Power BI dashboard to a client, the conversation changes completely. Instead of spending the first fifteen minutes of every meeting explaining why Facebook says one thing and Google says another, you present a single, unified view of campaign performance.
Your clients see one conversion number that has been verified and deduplicated, along with clear cost-per-acquisition figures calculated from verified spend and verified conversions. They get channel comparison views that use consistent definitions, and trend analysis based on clean, standardized historical data. They can also see a transparency layer that shows the raw platform numbers alongside the reconciled figures, so nothing feels hidden.
This level of clarity builds trust. Agencies that can explain not just what happened but how they measured it stand out from competitors who simply export platform screenshots into a slide deck. In a market where 66 percent of leaders say their campaign metrics often look successful but fail to drive actual revenue outcomes, being the agency that delivers trustworthy numbers is a serious competitive advantage.
Common Pitfalls to Avoid
Even with the right tools, agencies make mistakes when trying to reconcile marketing data. Here are the most common ones we see.
Trying to make the numbers match perfectly. They never will. Different platforms measure different things in different ways. The goal is not to force agreement but to provide a clear, well-documented methodology for how you arrive at your reported figures. Transparency beats false precision every time.
Ignoring data latency. Some platforms update in real time while others have a 24 to 72 hour delay. If you compare real-time Google Analytics data with Meta data that is still processing, you will see discrepancies that resolve themselves in a few days. Build your data model to account for latency differences.
Over-engineering the solution. You do not need a perfect data warehouse on day one. Start with the five or six most important metrics, get those reconciled and automated, and expand from there. A simple, reliable dashboard that covers the essentials is infinitely more valuable than a complex system that breaks every week.
Not documenting your methodology. Every reconciliation decision should be documented. When a new team member joins or a client asks why your numbers differ from what their internal team reports, you need a clear reference document that explains your data sources, transformation logic, and attribution methodology.
Start Fixing Your Agency's Data Problem Today
Conflicting marketing data is not a minor inconvenience. It is the single biggest barrier to earning and keeping client trust. The agencies that solve this problem, that can walk into a meeting and present numbers their clients believe without question, are the ones that retain accounts and win new business.
Power BI gives you the tools to centralize, standardize, and reconcile data from every marketing platform your clients use. Combined with a structured methodology and proper documentation, it transforms your agency's reporting from a source of confusion into a genuine competitive advantage.
At DA Lytics, we specialize in building Power BI reporting solutions for marketing agencies. Whether you need help setting up your first reconciled dashboard or want to overhaul your entire reporting infrastructure, we can help you deliver the kind of reporting that makes clients stay. Get in touch to see how we can support your agency's data strategy.