How to Cut Reporting Time by 70% with Power BI
Power BI Tips
The Hidden Cost of Manual Reporting
How many hours does your agency spend each week pulling data from Google Ads, Meta, LinkedIn, TikTok, and a dozen other platforms, just to build a single client report? If you are like most marketing agencies in 2026, the answer is somewhere between 10 and 15 hours per week, per analyst. That is time spent copying numbers, reformatting spreadsheets, and reconciling metrics that never quite match up across platforms.
The real cost is not just the hours. It is the strategic work that never happens because your team is buried in manual reporting. Power BI, combined with the right data pipeline, can cut that reporting time by 70% or more. In this guide, we will walk you through exactly how marketing agencies are automating their reporting workflows with Power BI and reclaiming hundreds of hours every month.
Why Manual Reporting Is Costing Your Agency More Than You Think
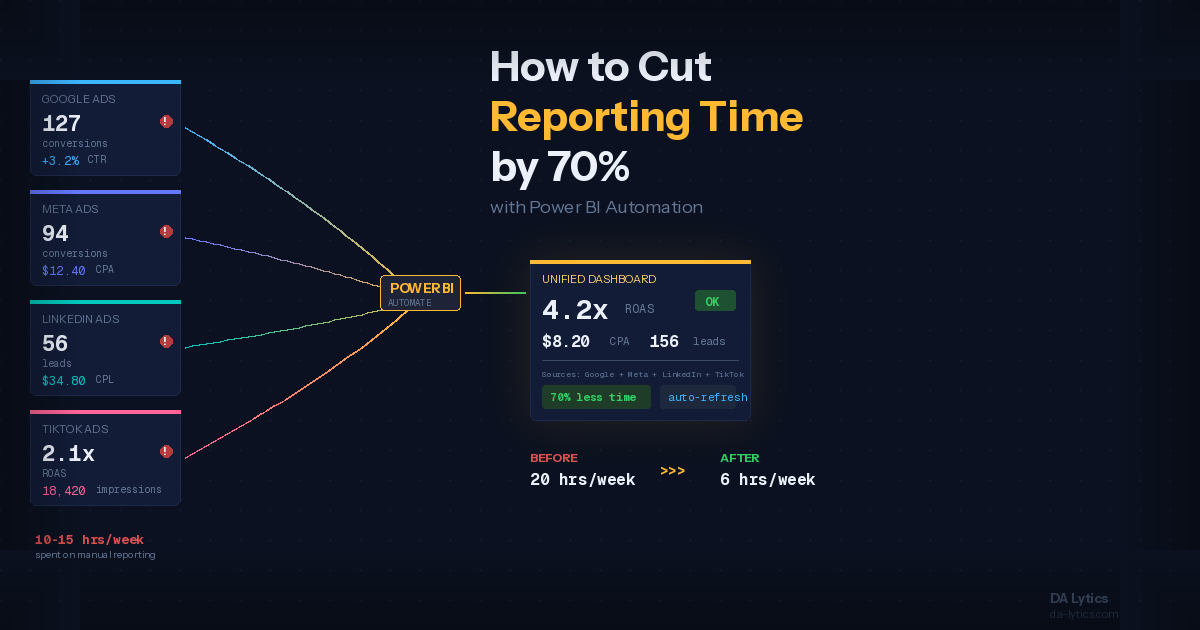
Most marketing agencies manage campaigns across 10 to 15 different advertising and analytics platforms. Each platform has its own dashboard, its own metric definitions, and its own date formats. Meta Ads Manager might show 127 conversions for a campaign while Google Analytics records 94 for the same time period, and your CRM logs 156 new leads. Same campaign, three different numbers.
This data fragmentation creates a cascade of problems. Analysts spend their mornings pulling CSV exports, cleaning column headers, and trying to make the numbers match. According to a 2026 marketing data report by Supermetrics, nearly eight in ten marketers say they do not have a clear signal on what is truly working, despite having more data and tools than ever before.
The financial impact is significant. If an analyst earning the equivalent of 30 to 50 euros per hour spends 10 hours a week on manual data wrangling, that is 1,500 to 2,500 euros per month in labor costs dedicated entirely to pulling and formatting numbers rather than analyzing them. Multiply that across your team and client base, and manual reporting becomes one of the largest hidden expenses in your agency.
The Power BI Automation Framework for Agencies
Cutting reporting time by 70% does not require a massive technology overhaul. It requires a structured approach that connects your data sources, automates the transformation, and delivers polished reports without manual intervention. Here is the framework we use at DA Lytics when implementing Power BI reporting solutions for marketing agencies.
Step 1: Centralize Your Data with a Marketing Data Hub
The foundation of automated reporting is a single, reliable data pipeline. Tools like Funnel.io connect to over 600 advertising, analytics, and CRM platforms, pulling data automatically and normalizing metrics so that impressions, clicks, and conversions mean the same thing regardless of the source platform.
Instead of logging into each platform and exporting CSVs, your data flows into a centralized hub where currency conversions happen automatically, naming conventions are standardized, and historical data is preserved. This single step alone eliminates 40 to 50% of the manual work most agencies deal with every reporting cycle.
Step 2: Build Reusable Power BI Templates
One of the biggest time sinks in agency reporting is rebuilding the same dashboard structure for every client. With Power BI, you can create standardized report templates that include your core KPI cards, trend visualizations, and campaign breakdowns, then simply connect each new client's data source.
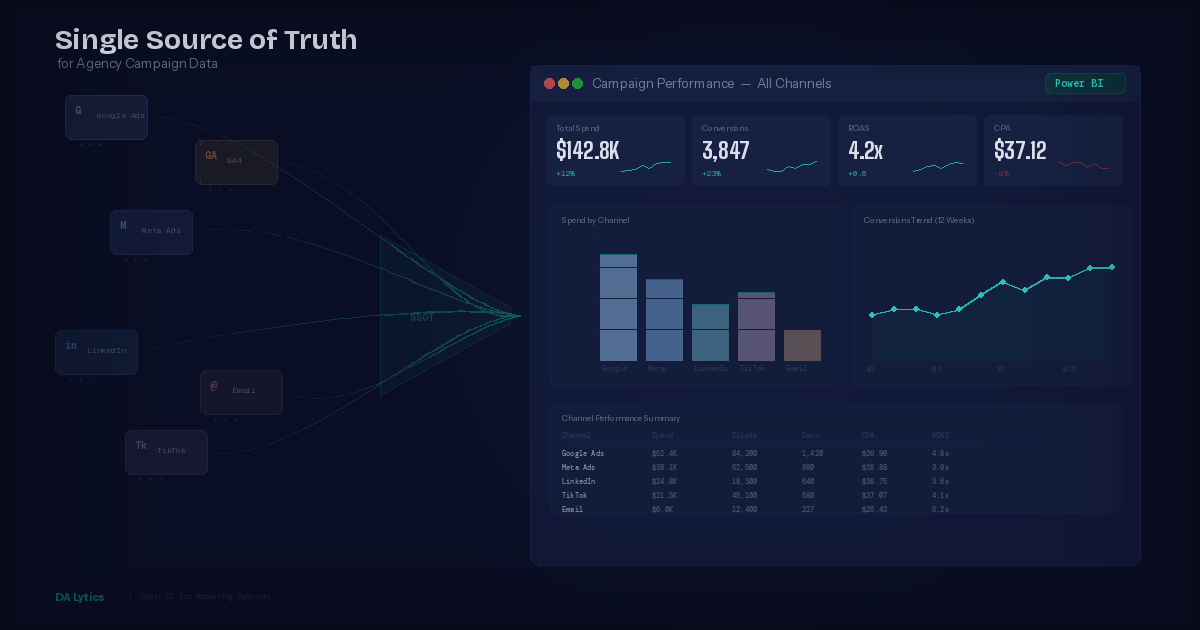
A well-designed template typically includes an executive summary page with high-level KPIs like ROAS, CPA, and total conversions, a campaign performance page with drill-down capabilities, a channel comparison view showing spend and results across platforms, and a trend analysis section with month-over-month and year-over-year comparisons. Once the template is built, onboarding a new client's reporting takes hours instead of days.
Step 3: Schedule Automatic Data Refreshes
Power BI Service allows you to schedule automatic data refreshes up to eight times per day. This means your dashboards always show the latest data without anyone manually triggering an update. For most agency reporting needs, a daily refresh is sufficient, but for high-spend campaigns, you might want more frequent updates.
Combined with Power BI's row-level security, you can even give clients direct access to their own dashboards, eliminating the need to export and email PDF reports entirely. Clients get real-time visibility, and your team gets back the hours they used to spend on report distribution.
Step 4: Use Power Query for Automated Data Transformation
Power Query, the data transformation engine built into Power BI, is where the real automation magic happens. Instead of manually cleaning data in spreadsheets every week, you define your transformation steps once and they execute automatically every time the data refreshes.
Common transformations for marketing agencies include renaming columns to match your reporting standards, filtering out test campaigns or internal traffic, creating calculated columns for metrics like cost per click or conversion rate, merging data from multiple platforms into unified campaign-level views, and handling currency conversions and date format standardization. Every transformation step you automate in Power Query is a step your analysts never have to repeat manually.
Step 5: Implement DAX Measures for Dynamic Calculations
DAX, the formula language in Power BI, lets you create measures that calculate dynamically based on the filters and context applied to your report. This means a single report can serve multiple purposes without separate builds.
For example, a single ROAS measure defined as ROAS = DIVIDE(SUM(Revenue), SUM(AdSpend), 0) will automatically recalculate whether a user is looking at the entire account, a specific campaign, a particular date range, or a single channel. No more creating separate spreadsheet tabs for each view. Your team builds the logic once, and Power BI handles the rest.
Real Results: What 70% Time Savings Looks Like
Let us put concrete numbers behind the 70% claim. Consider a mid-sized marketing agency managing 15 clients, each running campaigns across four to five platforms.
Before automation: Two analysts spend a combined 20 hours per week on reporting. That includes 8 hours pulling and formatting data, 6 hours building and updating reports, 4 hours on quality checks and reconciliation, and 2 hours on distribution and follow-up questions from clients.
After Power BI automation: The same reporting takes roughly 6 hours per week total. Data pulls and formatting are fully automated through Funnel.io and Power Query, taking zero manual hours. Report updates happen automatically with scheduled refreshes. Quality checks are reduced to spot-checking automated outputs, taking about 2 hours. Client access is self-service through Power BI dashboards, with only 1 hour needed for custom requests and strategic commentary.
That is a 70% reduction in reporting time, freeing up 14 hours per week, or roughly 60 hours per month, that your team can redirect toward strategy, client relationships, and business development.
Three Common Questions About Power BI Reporting Automation
How long does it take to set up automated reporting in Power BI?
For a typical agency with 5 to 10 data sources per client, the initial setup takes two to four weeks. This includes configuring the data pipeline, building templates, setting up scheduled refreshes, and testing. After the initial implementation, adding new clients to the system takes one to three days. The setup investment pays for itself within the first two months through time savings alone.
Do we need to replace our existing tools to use Power BI?
No. Power BI works alongside your existing marketing stack, not instead of it. Your team continues using Google Ads, Meta Business Suite, and whatever other platforms they manage campaigns on. Power BI sits on top as the reporting and visualization layer, pulling data from all sources into one place. A data integration tool like Funnel.io acts as the bridge between your ad platforms and Power BI.
Can clients access Power BI dashboards directly?
Yes. Power BI offers several options for client-facing reporting. You can publish dashboards to the Power BI Service with row-level security so each client only sees their own data. You can embed dashboards into a client portal or your agency's website. Or you can use Power BI's built-in export features to generate scheduled PDF reports that are emailed automatically. The best approach depends on your clients' technical comfort level and your agency's service model.
Getting Started: Your First Automated Report
If your agency is still relying on manual reporting, the transition does not have to be overwhelming. Start with one client and one use case, perhaps a monthly performance overview that currently takes your team several hours to build. Automate that single workflow from data collection through visualization, and measure the time savings. Once you see the results, scaling across your client base becomes a straightforward process of replicating the pattern.
At DA Lytics, we specialize in implementing Power BI reporting solutions for marketing agencies. From initial data pipeline setup through template design and ongoing support, we help agencies transform their reporting workflows and reclaim the time they need to focus on what actually drives results for their clients. If you are ready to stop spending your weeks on manual reports, get in touch and let us show you what automated reporting looks like for your agency.