Data solutions you can trust us with
Power BI reporting and advanced solutions
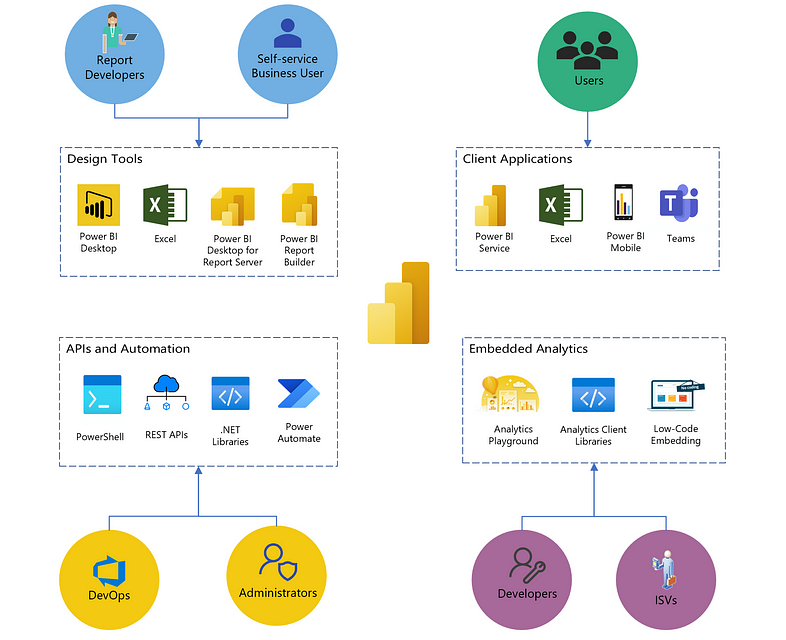
Power BI is our core practice. We build reports from a blank canvas, take over reports that have outgrown their original design, and make existing models cheaper and faster to run. Every report we build is meant to be maintained by someone else later, so the measures are documented and the model is clean. No logic hidden inside a visual. See example Power BI reports.
Semantic model, DAX measures, report layout, row-level security roles and rollout. We build the model first and the visuals on top of it.
Model restructuring, measure rewrites, and layout and navigation redesign on reports you already run. Existing business logic is documented and carried across.
Migration from Tableau, Qlik, Looker, Excel and legacy platforms. We document the source logic, rebuild it in DAX, and reconcile output against the original before anything is decommissioned.
Connections to REST APIs, SharePoint, on-premise and cloud databases, and flat files. Includes gateway configuration, scheduled refresh, and incremental refresh where volumes need it.
Measure rewrites using VAR and RETURN, star schema restructuring, and cardinality reduction. We profile with Performance Analyzer and DAX Studio before changing anything.
Workspace and app structure, access control and RLS roles, deployment pipelines across dev, test and production, refresh scheduling, and capacity monitoring.
Power BI Report Builder (.rdl) reports for print, PDF and Excel export. Multi-page layouts, subscriptions, and pixel-accurate formatting for finance, operational and regulatory output.
Vega and Vega-Lite specifications built in Deneb: radar charts, sankeys, bullet charts and custom KPI layouts, themed to your brand and cross-filterable like any native visual.
Report embedding into your own product, portal or internal application. Service principal authentication, row-level security per user, and capacity sizing for your concurrency.
Microsoft Fabric implementation and management
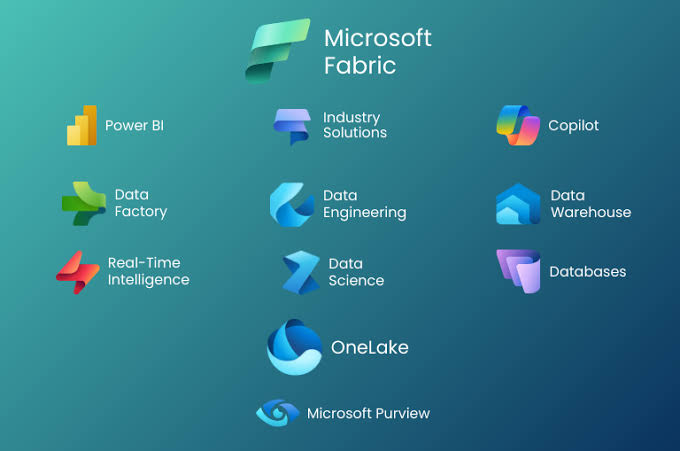
Fabric puts ingestion, storage, transformation and reporting on one platform, and on one capacity bill. We implement it end to end and then keep an eye on the bill, because an unmonitored capacity is how a sensible platform decision turns into an awkward invoice three months later.
Near real-time replication of SQL Server, Azure SQL, Cosmos DB, Snowflake and PostgreSQL sources into OneLake, with no custom extract jobs to maintain.
Scheduled and incremental data movement between source systems and Fabric, with monitoring, retry handling and failure alerting.
On-premises data gateway and VNet data gateway configuration for sources inside your own network, including clustering and credential management.
Warehouse and lakehouse design: schema, medallion layering, load patterns, and T-SQL transformation logic a semantic model can sit on directly.
Orchestration in Fabric Data Factory: dependency chains, parameterised activities, retries and failure alerting.
Reusable Power Query transformations with staging and destination configuration, shared across workspaces so one definition serves every report.
Capacity sizing against real CU consumption, scheduled pause and resume through Azure Runbooks, and workload tuning to hold concurrent users inside the tier you pay for.
Certified and promoted semantic models, org apps, and workspace structure that lets business teams build their own reports on governed data.
PySpark and Spark SQL notebooks for transformations, data quality checks, and processing that T-SQL alone cannot handle.
Data engineering and data platform work
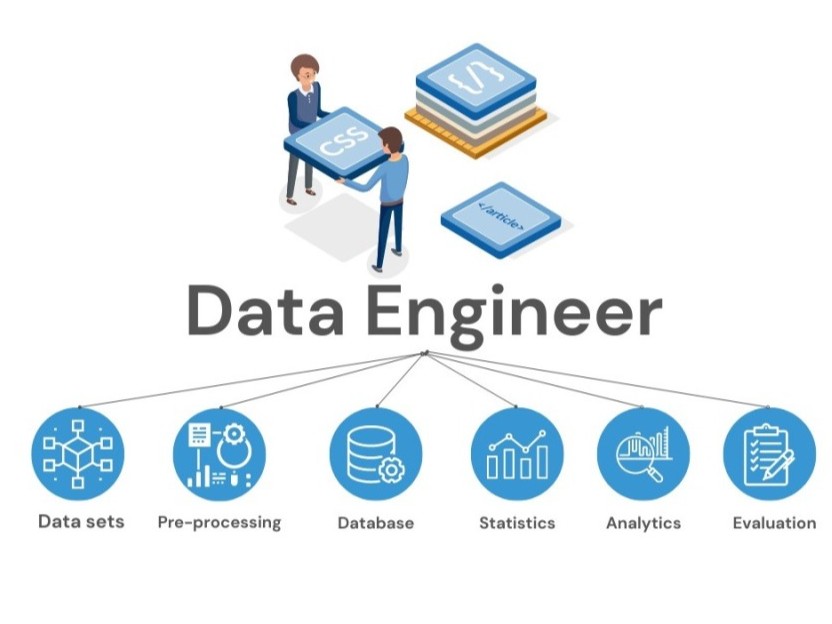
A report can only be as trustworthy as the data feeding it. We prepare, model and validate that data so the figure on the dashboard is the figure the business agrees on, and so the heavy lifting happens upstream instead of inside the report.
Scheduled extraction from third-party REST APIs and operational platforms, with pagination, rate-limit and incremental-load handling, landed into your warehouse.
Cleaning, deduplication, conformed dimensions and star schema modelling, delivered as documented analysis-ready tables.
Modelling sources that arrive at different aggregation levels, down to individual transaction lines, using bridge tables and a defined grain per fact table.
BigQuery warehouse builds with Dataform for SQL transformation workflows: version control, dependency graphs, assertions and scheduled releases.
Warehouse development on SQL Server and Azure SQL, with dbt models, tests, snapshots and generated documentation.
Moving calculation logic out of DAX and Power Query into views, stored procedures or dbt models, which reduces model size and refresh duration.
Execution plan analysis, indexing, partitioning and query rewrites on long-running jobs that block downstream refreshes.
Automated tests for row counts, referential integrity, duplicates, null thresholds and reconciliation against source, with alerting on failure.
AI-ready data and workflow automation
Most AI projects we see stall on the data rather than the model. An assistant can only answer well if the data it reads is clean, described, and consistent, and that preparation is the same discipline as good BI modelling. It is why this sits next to everything else on this page rather than on a separate AI landing page.
Documents, text and other unstructured sources brought together with warehouse data into a single queryable layer.
Cleaning, deduplication, consistent grain and enrichment, so a dataset returns the same answer to the same question each time it is queried.
Descriptive table and column names, column descriptions, synonyms, defined measures and verified answers in the semantic model, so natural-language queries resolve to the intended fields.
Certified semantic models, documented measure definitions and access structure, so teams query one governed source instead of maintaining separate extracts.
Canvas and model-driven apps for entering, correcting or commenting on data at source, writing back into the warehouse.
Approval flows, data-driven alerts, scheduled exports, and notifications triggered from Power BI.
n8n workflows connecting the tools in your stack where standard connectors do not reach: data movement, webhooks and event triggers.
Threshold and exception alerts on measures, refresh failure notifications, and capacity monitoring routed to the owner responsible.
How a DA Lytics engagement runs
The same five steps apply whether the work is a single report or a full platform build. Scope gets agreed before development starts, and nothing is handed over without being checked against source. You can also read how we approach this.
Three ways to engage
Fixed-scope project
A defined deliverable at an agreed price and timeline. This suits a specific report, a migration, or a first implementation.
Ongoing implementation and support
A retained arrangement covering enhancements, new reports, monitoring and platform maintenance as your reporting estate grows.
Embedded BI developers
Our specialists working inside your team, on your backlog and in your tools, for when you need capacity rather than a project.


.webp)